
A Year in Review
#134: The lookback at 2024 sets the table for the year ahead.


With 2024 nearly in the books, it’s just about time to look ahead to 2025. As with last year, I will dedicate these last three weeks of the year to (i) a review of 2024 dynamics and our ideas, (ii) a 2025 macro outlook and portfolio recommendation, and (iii) a list of 2025 trade ideas. Let’s dive in.
Twelve Months in Five Minutes
Can you say goldilocks?
One of the great platitudes of finance was an apt description of this latest loop around the sun. With powerful inertia in equities, a sturdy macroeconomic backdrop, and ongoing monetary easing, there were few reins on this bull market.
Of course, there were some wobbles along the way. First, hot inflation prints in January and February pushed out the highly anticipated rate cuts, and “higher for longer” dominated the macro narrative through the spring. Rising yields punished fixed income and highly leveraged equities.
The big winners of 2023 — big tech, AI — maintained their dominance throughout the first half of the year and anything plausibly connected to NVIDIA soared. Through early July, the so-called Magnificent 7 had already gained 46%, with these behemoths contributing the lion’s share of returns for the entire S&P 500. Meanwhile small caps struggled just to keep their head above water.

But news of ever-so-slight-deflation! in the June CPI numbers released on July 11th turned the tide — cementing rate cuts and sparking a sudden and fierce move out of leaders and into laggards. The Great Rotation injected some much needed breadth into the historically concentrated market, allowing small-caps to make up some ground.

Through the summer, we saw the first real glimpse of macroeconomic concerns as a series of negative labor reports pushed the unemployment rate toward the “Sahm rule” recession indicator, prompting talking heads to demand emergency rate cuts. I too worried that the U.S. economy might be on a Slippery Slope. But just as soon as the FOMC obliged with a 50bps September slash, the dreary data turned upbeat yet again. Goldilocks indeed.
With growth concerns subsiding in the fall, politics took the mainstage. Fears of an October Surprise! or Civil Unrest! kept the index subdued and volatility conspicuously elevated ahead of the big night. But a quick and decisive verdict crushed the VIX and sprung the S&P 500 past 6,000 for the first time.

The post-election euphoria seemed to kick-start the animal spirits. The month of November saw a new record for equity call volumes, surpassing the high watermark of 2021. Old dogs doing old tricks; Tesla posting a new record as Bitcoin broached $100,000. The very far end of the risk curve — crypto alts, quantum, and flying cars — surged with elation leaving us to question whether the market had finally Jumped the Shark.
Spirits or not, U.S. equity appreciation has been widespread. Thus far, the S&P 500 has risen 28% with subsector performance ranging from +4% to +40%. Meanwhile the mid and small caps indices have gained 16% - 19%, an otherwise solid year if not for the long shadow of the large caps.
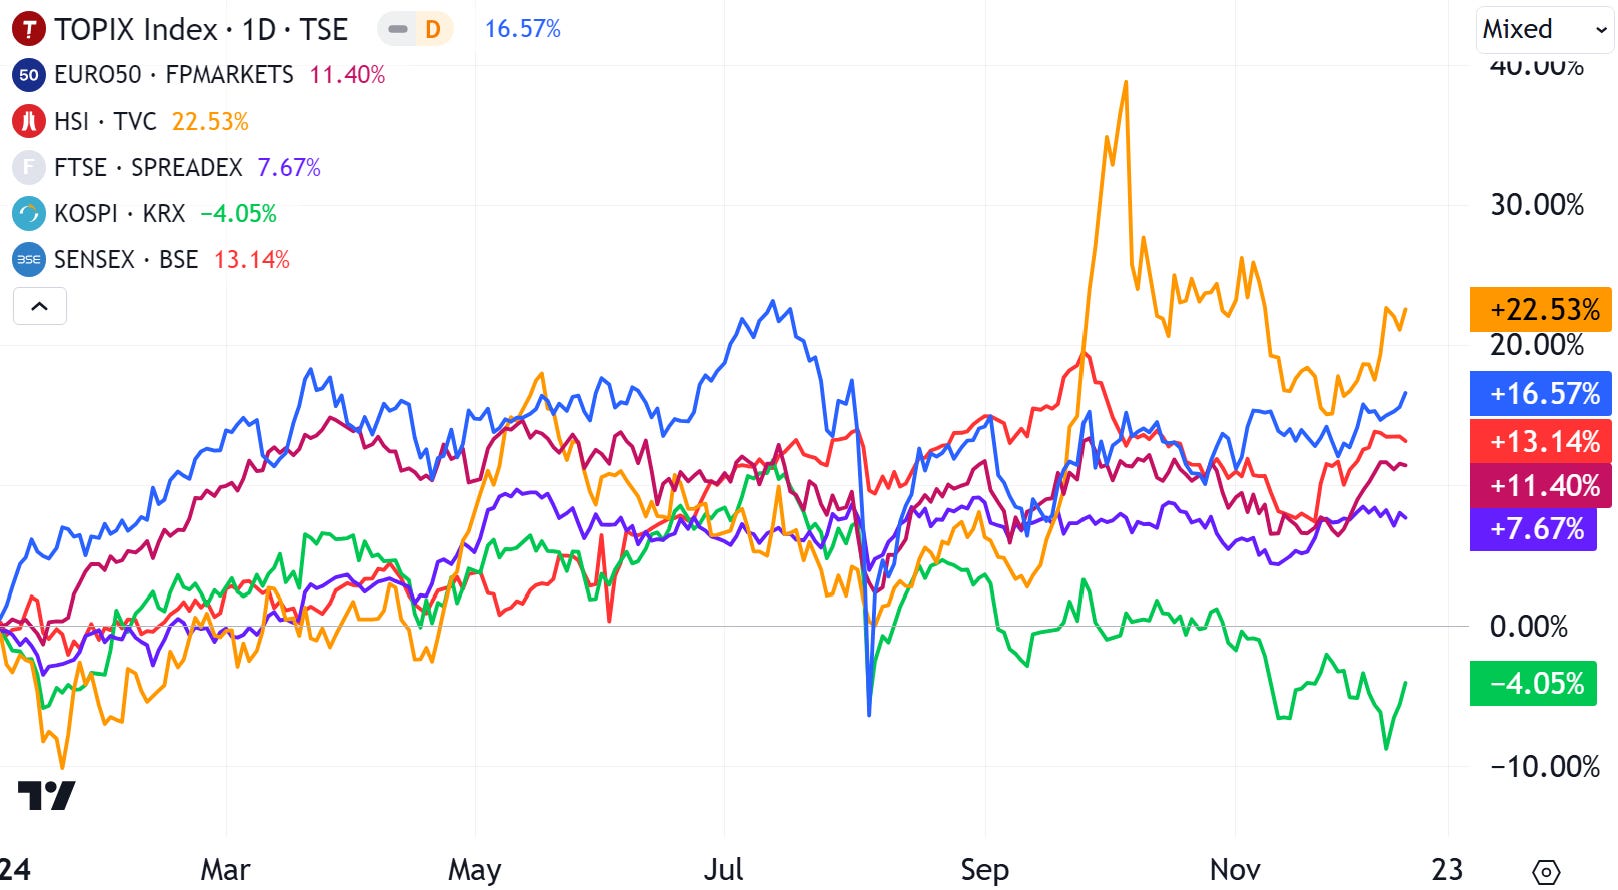
Meanwhile, most international indices posted solid gains, but struggled to match the torrid pace in the states. Hong Kong’s Hang Seng Index has been among the strongest performers, crawling out of its three year bear market as sentiment finally begins to turn the corner in China. (Unhedged USD investors in foreign markets likely saw lower effective returns as the dollar gained against most world currencies).
While equities have been a lovefest, fixed income performance has been less remarkable. With U.S. Treasury yields entering the year in deep inversion across the curve, the bar for further appreciation was high. Even with 75bps of rate cuts in the book so far, the 5, 10, and 30-yr UST yields have risen on the year, leaving long-duration sovereigns in the hole.

Treasuries remain caught in a tug-of-war, weighing rate-cut expectations against above-target inflation and an unending deluge of new supply from a widening deficit.
Corporate bonds have generally fared better than government debt, as credit spreads across the risk-curve have tightened, continuing the trend of the past two years. For CCC-rated junk, spreads have tightened by over 200bps on the year.

The move in credit spreads track the evolution of macroeconomic concern — spreads briefly widened through the summer on labor weakness, before compressing to new lows with a rebound in positive data. With few signs of default risk, the fixed income market continues to be driven by macroeconomic and monetary policy considerations.
In short — it was a year that rewarded market participation and risk taking, with the most crowded and consensus sectors leading the way.
Against this backdrop, how did The Last Bear fare?