The Volatility Divergence
#128: Despite resilient equities, implied volatility pushes higher.
One dominant feature of the market rally that began in late 2022 has been the smothering of volatility.
Realized and implied volatility — the actual and expected range of stocks and indices inferred from options pricing — declined from the boisterous baselines of the COVID-era back to mundane ranges. Pricing of tail-risk and deep out-of-the-money hedges saw an even more extreme shift from historically expensive to historically cheap. Measures of correlation between stocks reached record lows, as the “dispersion trade” became the talk of the town. Dampened volatility was both a product and driver of the S&P 500’s ~60% surge.
That is, until recently.
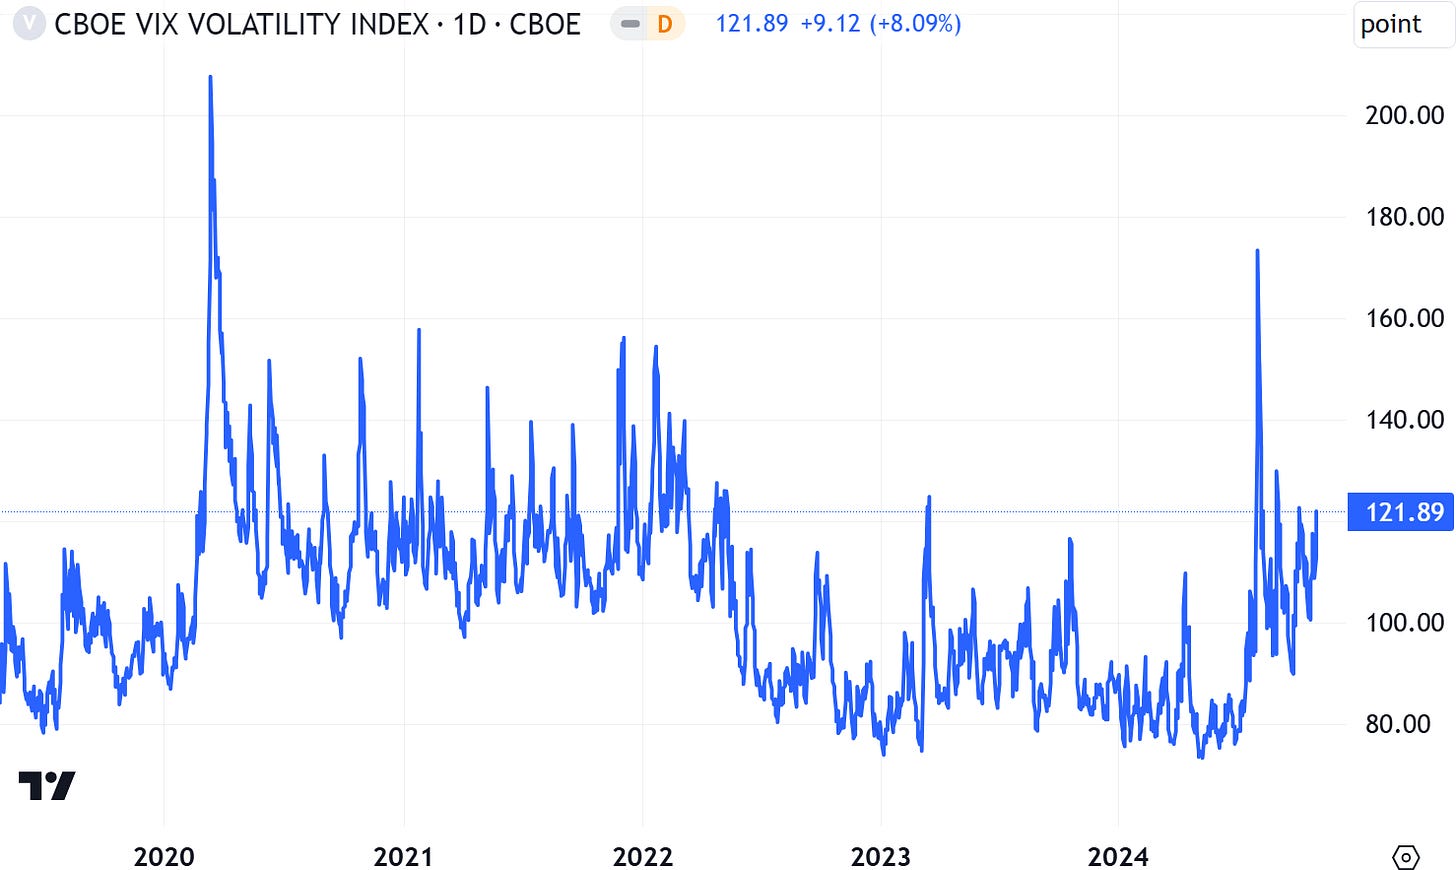
Volatility began to climb in early July, as a rotation towards small caps stole the wind from big tech and other crowded tag-along positions. Shifting monetary policy, FX upheaval, and a bit of macroeconomic angst ultimately culminated in a brutal but brief global flash crash which temporarily sent the VIX over 50 in the U.S. pre-market hours of August 5th — the highest reading since March 2020.
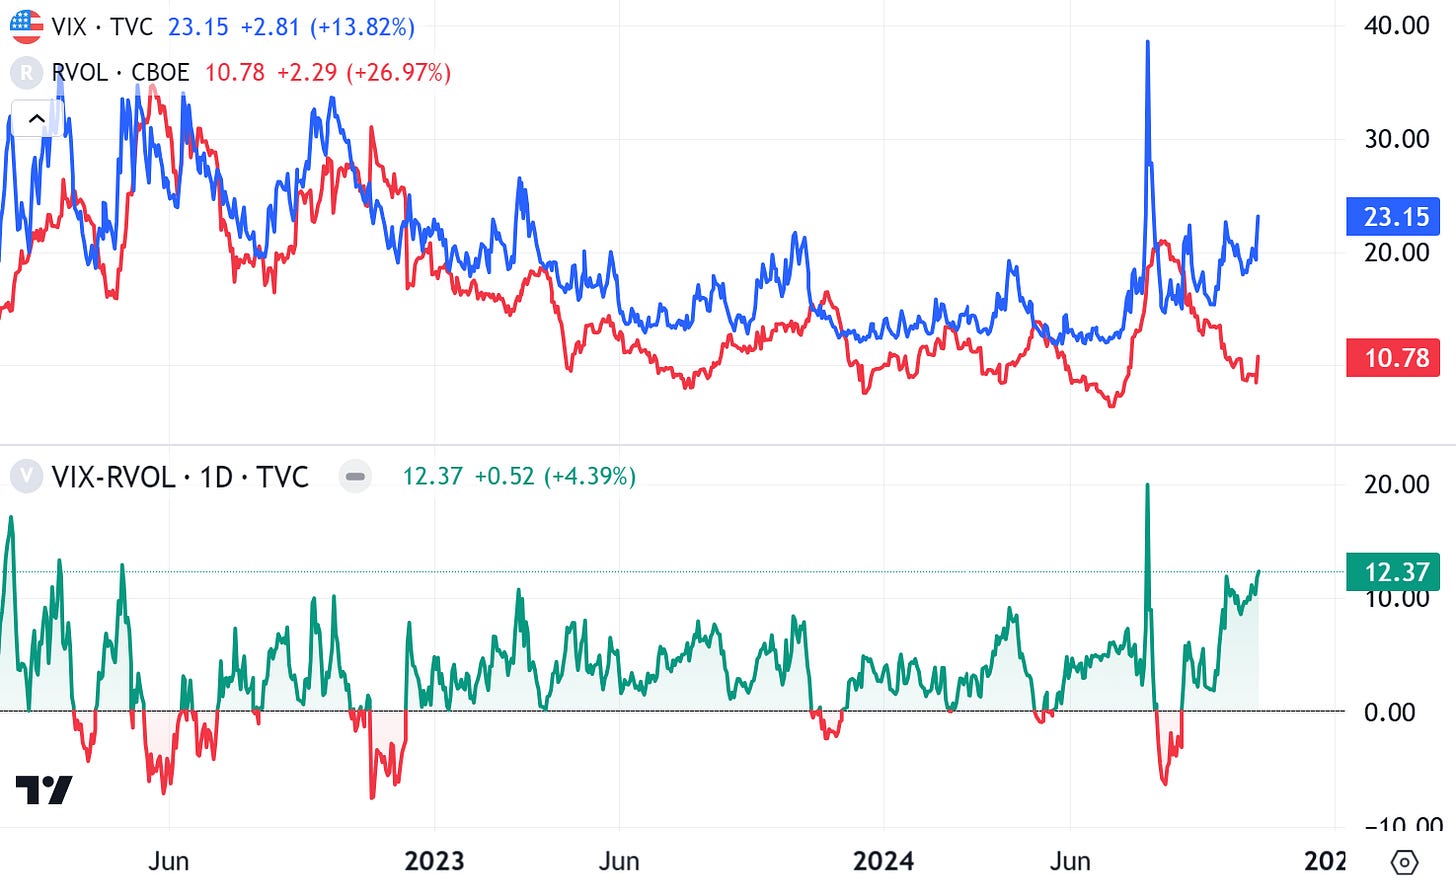
For stocks, the pain was short lived. U.S. indices quickly recovered losses, and have returned to trade near all-time highs. But even as equities have proven resilient, the market’s pricing of volatility continues to push higher. Since July, VIX and VIX futures have settled at a higher and higher base. Excluding the early-August flash crash, yesterday’s VIX close of 23.15 is the highest level since the Silicon Valley Bank blowup.
While equity and volatility indexes are not perfectly negatively correlated, this level of extended divergence is rare. We have now seen three months of consistently higher stocks and consistently higher implied volatility — and not just in the VIX.
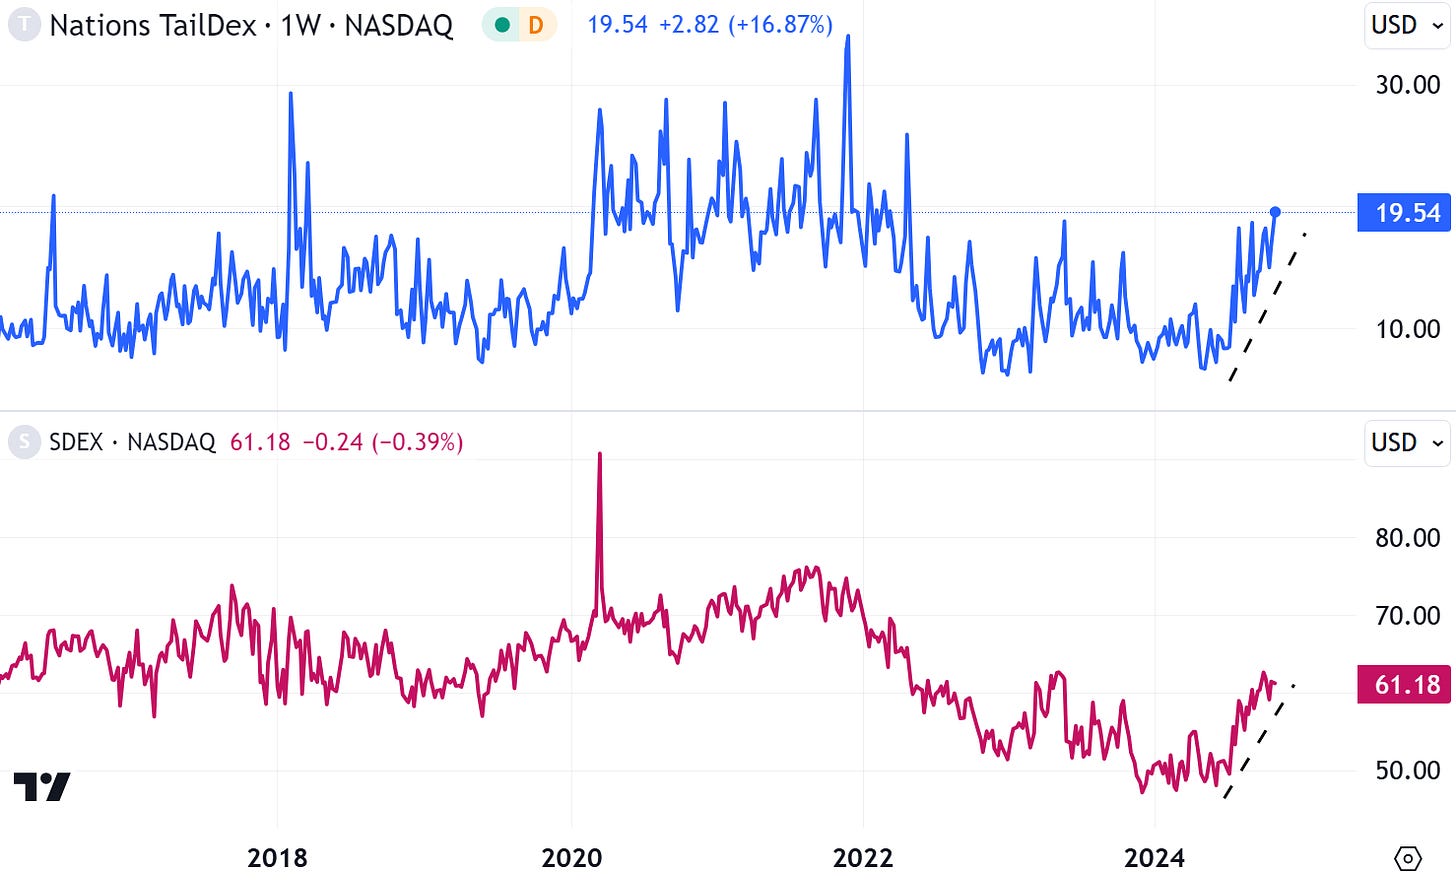
Back in May, the price of VIX options — volatility of volatility (VVIX) — traded at the lowest level in 10 years. But over the past several months, the price of tail-risk protection has surged.
Similarly, the price of tail-risk protection has increased substantially. The Nations’ TailDex index, which measures the cost of deep out-of-the-money puts, and the SkewDex index, which measures the difference between at-the-money and out-of-the-money puts have climbed off deep lows and are now near the highest level in two years. Even stock correlation has perked up, though it remains low by historical standards.
It’s not surprising to see variations in volatility, but the question is why now when actual realized volatility remains relatively low, and equities are trading near highs. Why has there been such a significant shift in the market price of risk, without proof of risks rising?
The top panel of the chart below shows both the VIX and actual 30-day realized volatility, and the bottom panel shows the spread between the two. These two series aren’t exactly comparable — the VIX is forward looking, while realized volatility is backward looking. Even so, the gap between recent experience and future expectations is the largest in several years.
Is the insurance market seeing risks that equities ignore?
In this week’s 128th installment of The Last Bear Standing, I analyze several possible culprits, including corporate earnings, macroeconomic concerns, the U.S. election, and volatility supply/demand.
Let’s dig in.


