The Volatility Squeeze: Part 3
#5: On the rumored death of volatility.
Note: This week’s post builds off The Volatility Squeeze Part 1 and Part 2 and will lean technical. I won’t re-define or explain these concepts here. If you are new to the topic, you can find background in the prior pieces. Do not make investment decisions based on any single person’s analysis. Do not buy anything you do not understand. The products discussed here carry very high risk.
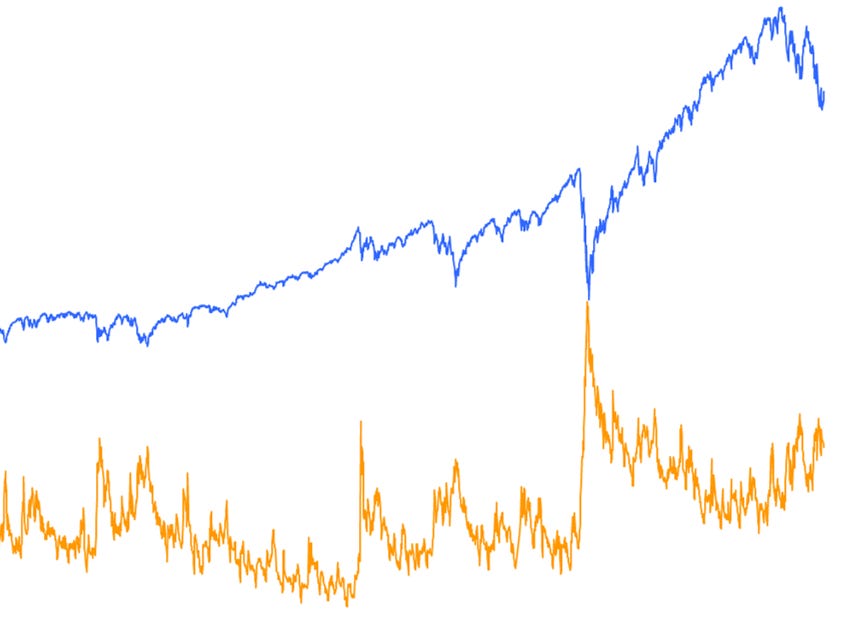
On November 18, 2021, I published a Twitter thread titled “Volatility, Price and Pain”. In the post, I argued that it was an attractive time to buy volatility (the financial product) either as a hedge for an equity portfolio or as a standalone directional bet against the market. The idea was simple; market price and volatility are inversely correlated, and large moves in market price coincide with even more extreme moves in volatility.
In other words, when the market goes up, volatility goes down. If the market crashes, volatility goes to the moon.
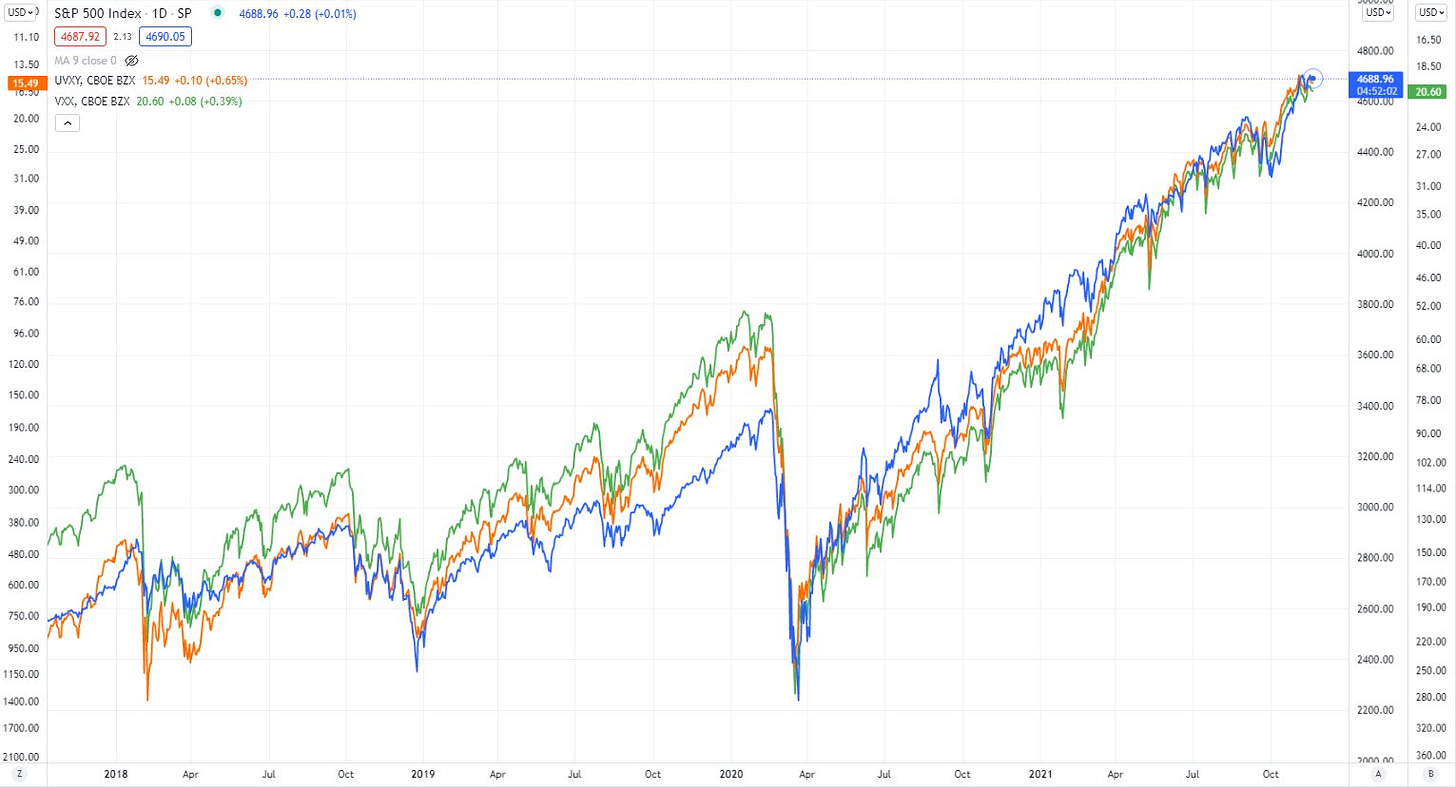
To visually demonstrate the relationship between equity market and price, I graphed the performance of two of the most popular long-volatility products, $VXX and $UVXY1, against the S&P 500. The S&P 500 was plotted on a typical linear scale, while the volatility products were flipped upside down (due to the inverse correlation) and plotted on a logarithmic scale.

My argument was that a long-volatility position was directionally equivalent to a short S&P 500 position but with much higher payouts in the tail end of the distribution.
This idea is not groundbreaking; most people are aware that the VIX spikes in moments of market stress. But in my view, the upside was being overlooked largely because of the fact that long-volatility positions almost always lose value before they pay out, and investors are very loss-averse.
In the weeks following my Twitter thread, the S&P 500 stumbled, falling by 4.5% at the low point on December 3rd. Over the same period, $VXX and $UVXY soared by 46% and 68% respectively. The market dip was more of a hiccup than a puke, but it led to enormous, immediate gains in these volatility products, seeming to prove my arguments almost immediately. Move over Chamath, there is a new “New Warren Buffett” in town.
Now, the S&P 500 is down 16% since November 18th. Yet despite this much larger market drawdown, $VXX is up just 13%2 and $UVXY is up less than 1%. The problem is not only with these specific products which are often criticized for their structure. The spot VIX index reached its intraday high on January 24th at 38.94 with the S&P 500 at 4,222. It has not broken that high since, even as the S&P traded down another 9.7% to 3,810 by late May.
So what gives?
The nonchalance in the spot VIX and VIX futures over the past several months has been notable. Others have provided competing explanations. Some suggest it is due to the pace of the declines - that a slow grind down will not lead to a volatility spike. Others suggest that the market is wiser after the previous VIX blowups in 2018 and 2020 and will be better positioned to avoid a similar outcome today. Still others say to wait for the final capitulation, a point we have not yet reached.
As someone who has written at length about the inevitability of a market-crushing short squeeze in volatility, the recent action has caused some healthy re-evaluation of the thesis. Knowing that readers may have taken risk based on my analysis makes it all the more important to provide an updated view.
Is volatility squeeze dead, or right around the corner?
The Five-Legged Race
If Apple’s stock goes down, it’s because there are more sellers than buyers. You may not know why that imbalance exists, but the proximate cause is clear. While the market for volatility is more complicated and multidimensional than a single stock, the same concept applies. The reason why volatility has “underperformed” relative to the change in market price is because there are relatively more sellers than buyers.
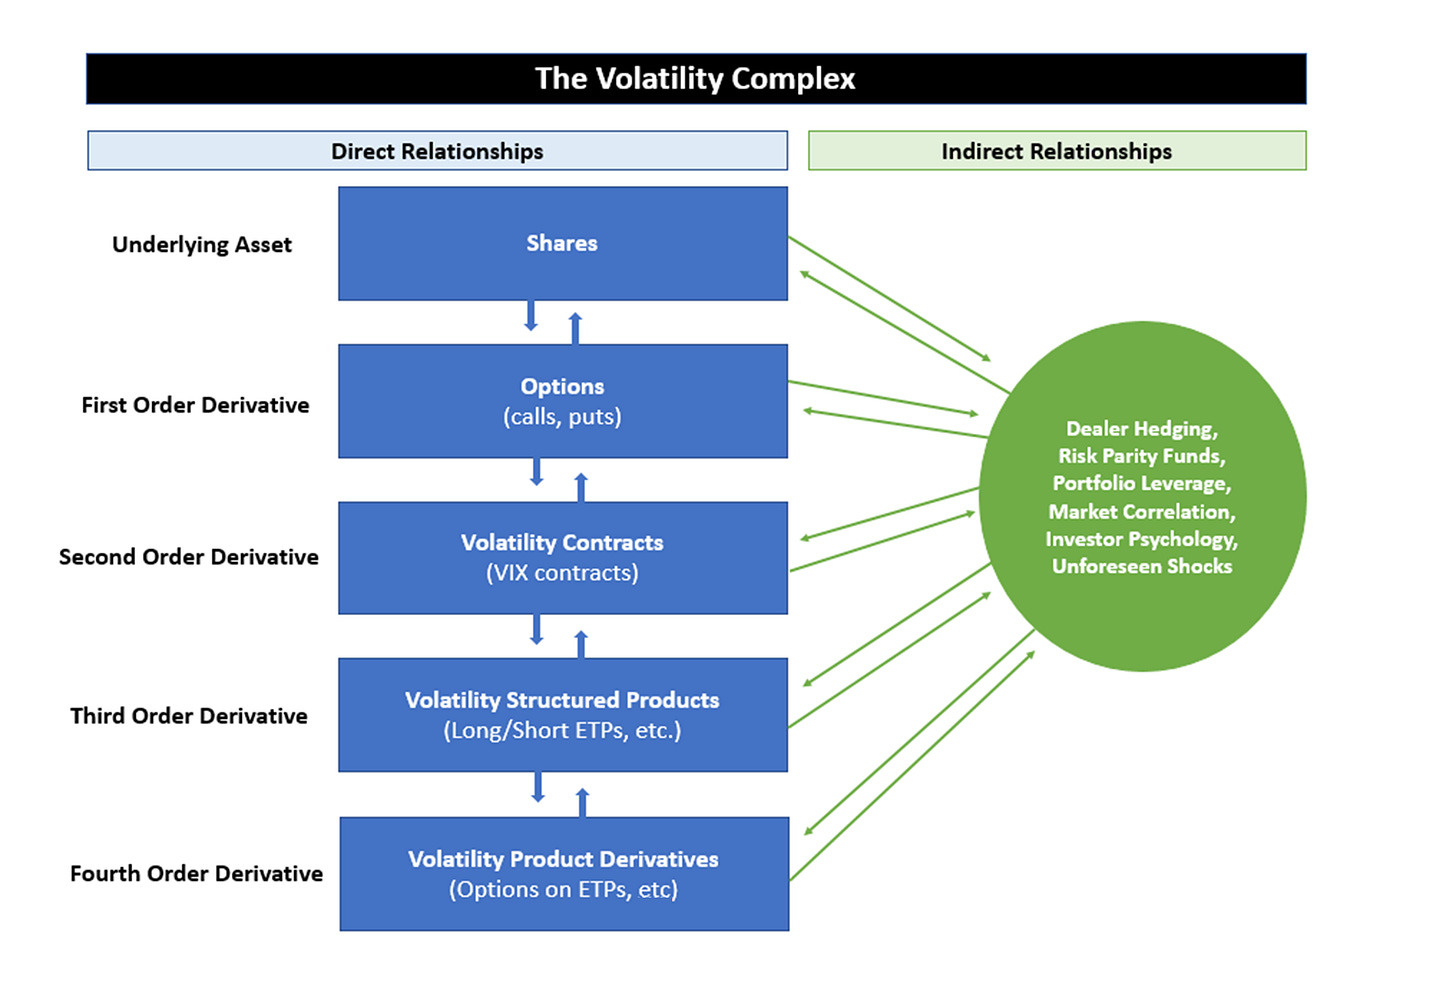
In past writings, I’ve outlined the “The Volatility Complex” shown below to describe the layers of financial products and derivatives that influence the price of volatility and the way in which they interact with each other.
But, maybe a simpler analogy is to think of four guys trying to run a race with their legs tied to each other. A “five-legged” race.
Each is a separate market with buyers and sellers, but they are linked to each other, either directly or indirectly through the chain. When one tries to run faster than the other, it pulls on its neighbors, giving them a boost but putting a limit on its own pace. One dude may try to run the opposite direction. He probably can’t overpower all three on his own, but he will slow the group substantially. If the four run together in stride, they move fast. You get the picture.
For a rapid move in volatility - one that will lead to a short squeeze - they need to run together. Let’s take each in turn.
Shares: Below is the S&P 500 overlaid with total volume at the bid vs. ask, which I find to be a good sentiment and flow indicator on a relative basis3.
(First, recall the negative correlation between market price and volatility - i.e. the market declining increases volatility). During the peak meme-stonk frenzy, most days were characterized by high volume buying, with occasional heavy selling interspersed. The summer of 2021 showed a low volume malaise as the market drifted higher. Since the market has rolled over in 2022, the average day has fairly heavy downside volume, but dip buyers come in with extreme force when the knife starts to fall. We’ve seen dramatic intraday reversals in January, February, March and again here in late May that have halted waterfalls. While the overall direction and sentiment seem bearish, BTFD is alive and well.
Options: The VIX index is derived from the options pricing and therefore the options market has an enormous impact on volatility. Below is the CBOE Put-to-Call Ratio in blue, compared to the VIX in orange. The red horizontal line is at a put/call ratio of 1.00, indicating an even number of each. Above the red line means more puts than calls.
Puts increase volatility, while calls suppress it4. Prior to the COVID crash in 2020, this ratio would fluctuate between put and call territory fairly regularly. However, in the COVID mania, an explosion of call buyers flooded the market, sending the indices ever higher and suppressing volatility in the process. For a year and a half this ratio almost never ventured into put territory - unprecedented historically. Now, the slow death of the call buyer combined with increasing interest in puts has pushed this ratio into put territory for the first time since 2020. This change in options balance is, in my opinion, the primary reason why VIX has remained resilient at historically elevated levels in the high 20s or low 30s. However, the current level of puts is still within a reasonably normal range - we have yet to see the extreme level of put buying that has punctuated every previous volatility squeeze.
Volatility: Specifically, I mean products that buy VIX futures contracts, such as the exchange traded products mentioned above, i.e. $UVXY, $VIXY, $SVXY. These products provide both institutional and retail investors direct access to volatility, the commodity, for hedging and speculation. These products have played key roles in all the recent examples of volatility blowups - the hedging mechanism of $XIV (a short-volatility ETF) caused Volmageddon, and massive inflows into $UVXY in late February 2020 kicked off the COVID crash.
The two largest long-volatility products, $UVXY and $VXX, are shown above. While $UVXY volumes have grown, they still have not topped the levels reached on January 24th - the day that spot VIX peaked near 39. $VXX, the largest long-volatility product by AUM (with the most active options chain), meanwhile was shuttered by Barclays on March 14th - the beginning of a nosedive in volatility and vol-of-vol.
These products and their influence on the entire market can’t be overstated. Any real volatility spike will likely be presaged by a rapid and sustained uptick in volumes of these products. Recent volumes remain below the January highs.
Vol-of-Vol: The VVIX measures the pricing of VIX options, and it is straight-up running in the opposite direction. As of writing, the VVIX is now at levels that have not been seen since before the pandemic, despite all the challenges the market now faces.
VVIX is largely driven by demand for VIX calls (upside bets on volatility). In the same way that buying calls can lift stock prices, buying VIX calls lifts the VIX - but right now absolutely nobody is buying.
The most obvious explanation is simply that volatility has drastically underperformed expectations - the entire topic of this post. People who bought calls expecting a spike did not get it, and are not interested in replaying the game. Further, folks who held unexpired options are likely dumping them for scraps - in the process crashing the implied volatility of volatility itself.
Ironically, this is the entire thesis of volatility squeeze in reverse. Who in their right mind would buy the VIX at 50? People who sold the VIX at 35. Who would sell VIX calls at 27 today? People who bought VIX calls at 35.
Summary: When looking at each layer of the volatility complex it becomes easier to understand the “underperformance” in volatility. Shares and options seem to be trotting (not running) in the direction of a squeeze. Volatility products look to be heading in the same direction but took a gunshot to the knee in March. Vol-of-vol, meanwhile, is sprinting in the opposite direction. The result is a disjointed mess going nowhere fast.
So is the squeeze dead?
Zooming Out
Our brains are slaves to the present. If you bought volatility in the past several months expecting the VIX to hit 100, and instead it rolled over like limp spaghetti, your psychological inclination is to pronounce volatility dead. Sometimes, it’s helpful to reflect on the bigger picture.
It was early October (the dotted red line below) when I wrote The Volatility Squeeze. I argued that a squeeze had begun - a war between buyers and sellers of volatility that would eventually bring down the markets. This was, in my view, an inevitability, though the timing was uncertain.
Since then, the market has provided more credibility to the thesis than contradiction.
Unlevered long-volatility products seem to have put in hard floors in January. Short-volatility products put in hard ceilings in November. The equity market appears to have crested at the turn of the year. Sentiment is deteriorating even faster than macro. The Fed has pivoted from “transitory” to 50bps hikes. Money guru Zoltan Poszar now writes “the extreme volatility and lack of liquidity you see in markets is by design, and the Fed will not be deterred by it, but rather that it will be emboldened by it”.
The rumors of the death of volatility are greatly exaggerated.
However, in the immediate term, the volatility complex is a four-headed monster tripping over itself. It will not win any races until all of its legs get in stride. But when they do…
$VXX or the “Barclays iPath Series B S&P 500 VIX Short-Term Futures ETN” constantly rolls near-term VIX futures contracts and therefore goes up when VIX futures rise and vice versa. $UVXY or “ProShares Ultra VIX Short Term Futures ETF” does the same thing except with 1.5x leverage - so the moves are directionally the same but amplified, with a higher ongoing carrying cost and compounding factor.
Well, at least this is what $VXX should have returned over the period. On March 14th, Barclays, the sponsor, announced it was halting new note creations - abandoning its role in keeping the price of $VXX tied to the underlying performance of VIX futures. Since then, it has deviated significantly from its fair value. Instead, I’ve quoted the return of $VIXY - an identical product that remains tied to the underlying.
The typical average is for this ratio to run negative, so this indicator should be considered in relative terms, not absolute terms.
This is not always true. You can have a call-fueled gamma squeeze that expands volatility, but this is more common for a single name, not an index. Occasionally this occurs in an index, as it did in August 2020, but it is rare and usually results in a swift correction, as it did in that instance.


Great write up!
I love all your write ups and this was the series that got me subscribed in the first place. By any chance are you planning on revisiting the topic of volatility with the current economic climate?