The Dog of the Dow
#81: Scanning for value in the Dow Jones Industrial Average.
The Dow Jones Industrial Average (DJIA), once the preeminent benchmark for the U.S. stock market, has lost much of its luster over the years. The DJIA's price-weighted methodology skews the index’ performance, and the relatively small sample of 30 large-cap companies limits its breadth compared to more comprehensive indexes like the S&P 500.
Nevertheless, I find the Dow interesting.
Because the index includes the leading companies across a diverse range of industries (technology, finance, insurance, retail, consumer products, industrials, pharmaceuticals, energy) the DJIA still provides valuable insight into the relative performance of major industry players and sectors. In other words, it provides a useful “comparison set” as we think about cross-industry valuation in large-cap stocks and overall market dynamics.
Deconstructing the Dow
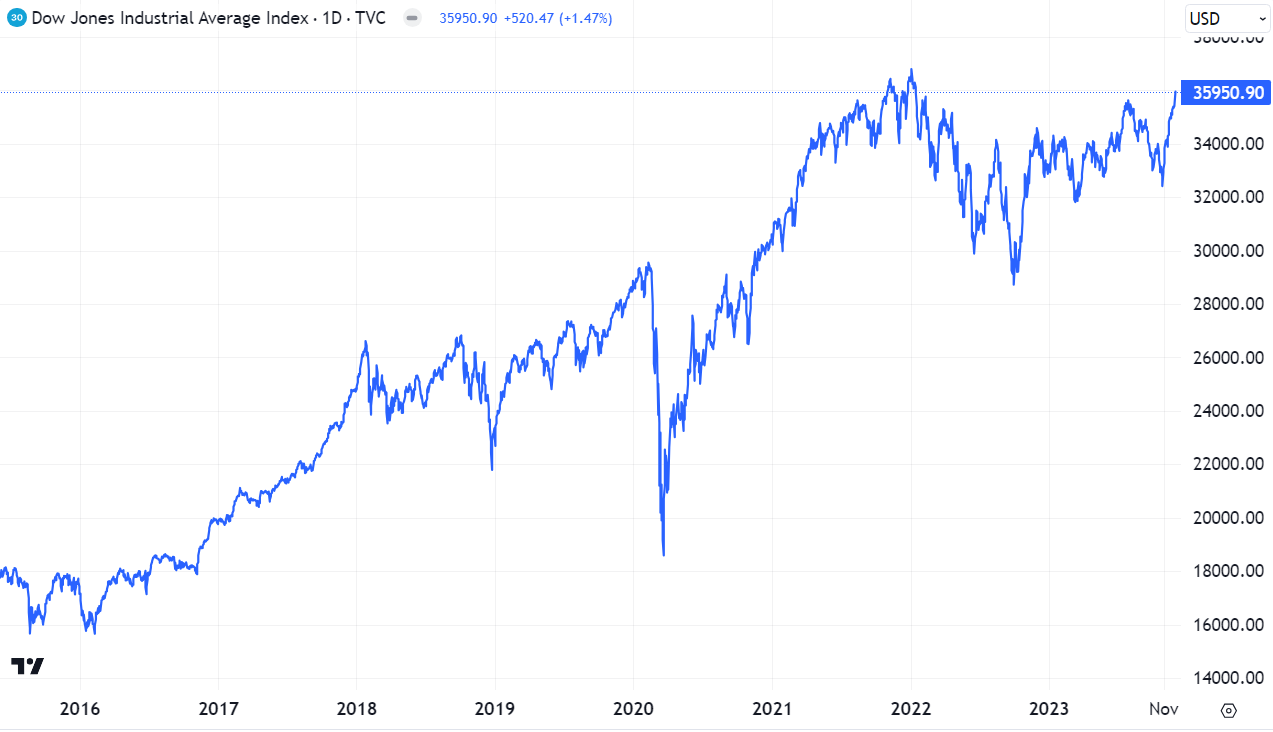
Over the past year, the DJIA has rebounded along with the rest of the market, and after the surge over the past month, the index sits within 3% of the all-time highs notched in early 2022.
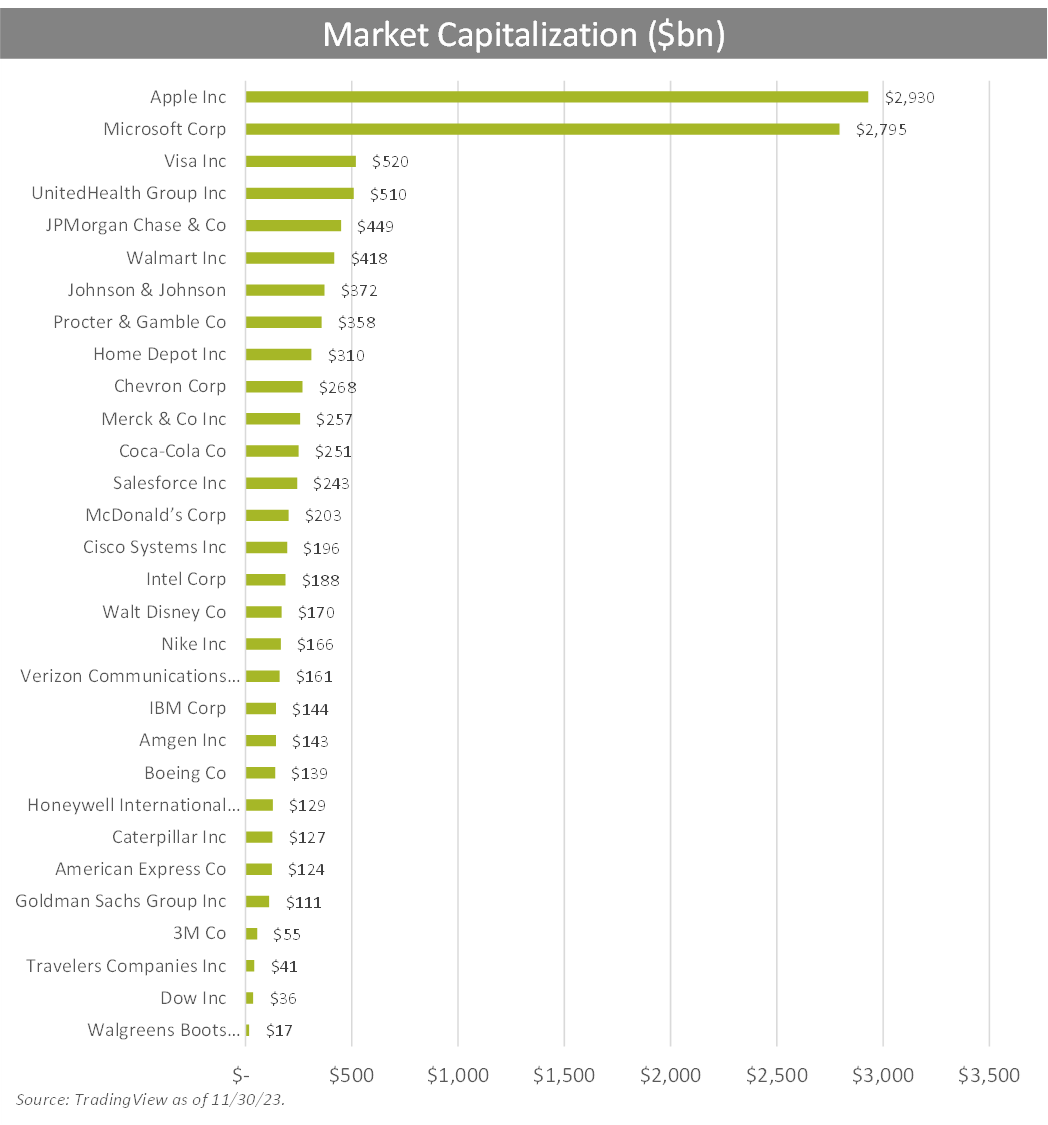
Of course, like the S&P 500 or Nasdaq 100, a component of this performance is attributable to the index’s tech behemoths Apple and Microsoft. While the dominance of mega-cap tech is no secret, it is still eye-opening to see Apple and Microsoft’s market cap stacked against the purported stalwarts of all other industries. By market cap, both companies are more than 5x larger than the next closest constituent (Visa).
Apple and Microsoft’s valuation is driven both by outsize earnings…
… combined with the highest forward earnings multiples in the index.
The two companies amount to 48% of the total market capitalization of the 30 constituents, while contributing 35% of the total estimated net income over the next year.
But mega-tech valuations are well known. Instead let’s focus on other end of the spectrum. What large-cap companies are trading on the cheap? One stands out.
After Apple and Microsoft, the most profitable company in the index is J.P. Morgan Chase (NYSE: JPM). JPM is the largest and most respected bank in the United States. It is expected to post $45 billion in net income over the next year. Nevertheless, the company trades at just 10x forward earnings — just one third of MSFT or AAPL’s forward P/E, and 8.1x lower than the median across in the index.
Below is the difference between each company’s contribution to Dow constituents’ total market capitalization vs. its contribution to total earnings.
This simplistic view of relative valuation shows the most “overvalued” companies at the top of the list and the most “undervalued” at the bottom, in total dollar terms1. MSFT and AAPL top the list while JPM is dead last.


