Price-Risk Singularity
#43: On Risk and Return in the Stock Market.
At the heart of finance is risk and return.
Returns are the expectation of profit based on an investment’s future cash flows. But we don’t just maximize for expected return, instead we maximize risk-adjusted returns. Higher risk investments should be priced to a higher expected return in order to compensate for a wider distribution of outcomes and the potential for loss.
All financial assets implicitly price risk.
Lenders evaluate the creditworthiness of a borrower and adjust interest rates accordingly. When lending to a corporation, a bank will evaluate the capital structure of the company and project cash flows under downside scenarios to evaluate whether the loan can be repaid. When issuing a mortgage loan, a lender considers the FICO score of the homebuyer.
In the bond market, risk is expressed by credit spreads. Sovereign debt yields are generally considered the “risk-free rate”1. Investment Grade (IG) corporate bonds from high-quality issuers typically trade at a premium to sovereign debt to account for the incremental risk. High Yield bonds from weaker companies trade at a premium return to IG bonds and so on.
Equities are no different. The most commonly cited equity valuation formula, the Capital Asset Pricing Model (CAPM), begins with the risk-free rate and adds an Equity Risk Premium (ERP) which provides incremental compensation for the equity risk of uncertain cash flows and market fluctuations.
Today, rather than measuring risk as a spread to fixed-income securities through the ERP, equity risk is quantified and traded through options and volatility. The options market prices the potential movements of stocks or indices, allowing investors to trade probabilities and hedge risk2.
Stocks with higher implied volatility – a wider range of expected price movement – carry a higher risk. If you consider two stocks with the same expected future cash flow, but the first stock displays a wider range of trading price (and therefore higher implied volatility), that first stock should cost less than the second.
Similarly, if implied volatility of a single stock increases, the price of that stock should decrease, even without a change to the expected future cash flows3. This explains the highly reliable negative correlation between volatility (risk) and price at the index level. The S&P 500 rises as the VIX falls and vice versa.
This correlation is supported by the theoretical risk framework, but is enforced on a daily basis by trading strategies that make it so. In the same way that a stablecoin’s peg is maintained by arbitrageurs, the relationship between price and volatility is maintained by market participants that trade on the assumed correlation.
Plotted down to the minute in a recent trading session, the inverse relationship of S&P and the VIX is impossible to ignore.

In other words - we have reached price-risk singularity. Current market prices incorporate the current market price of risk. Today’s price is already risk-adjusted.
Changes in stock prices can be driven both by changes in expected return or changes in risk. Over the long-term, the market is driven by rising corporate earnings (the return), as risk and volatility revert to the mean. But short-term fluctuations are often driven by changes in volatility (the risk-adjustment).
While this sounds obvious, our tendency is to attribute price moves to changes in expected returns. If the Nasdaq is going up, we say that investors are excited about AI. Volatility, meanwhile, is often considered a derivative of price.
In reality, the two forces play off each other reflexively. Like two coiled snakes, they may pull in different directions at a given moment, but ultimately are bound together. An influx of new stock buyers may drive up prices and compress volatility, or sellers of volatility may compress the market risk-adjustment, and drive up market prices as a result.
Since equity risk is quantified, packaged and traded as volatility, we can infer the “risk-adjustment” in market prices at any given time. Then, we can calculate volatility-normalized prices which ignore fluctuations in the risk-adjustment and isolate changes in return expectations. In doing so, we gain a clearer view of the forces driving the market.
Risk-Normalized Price
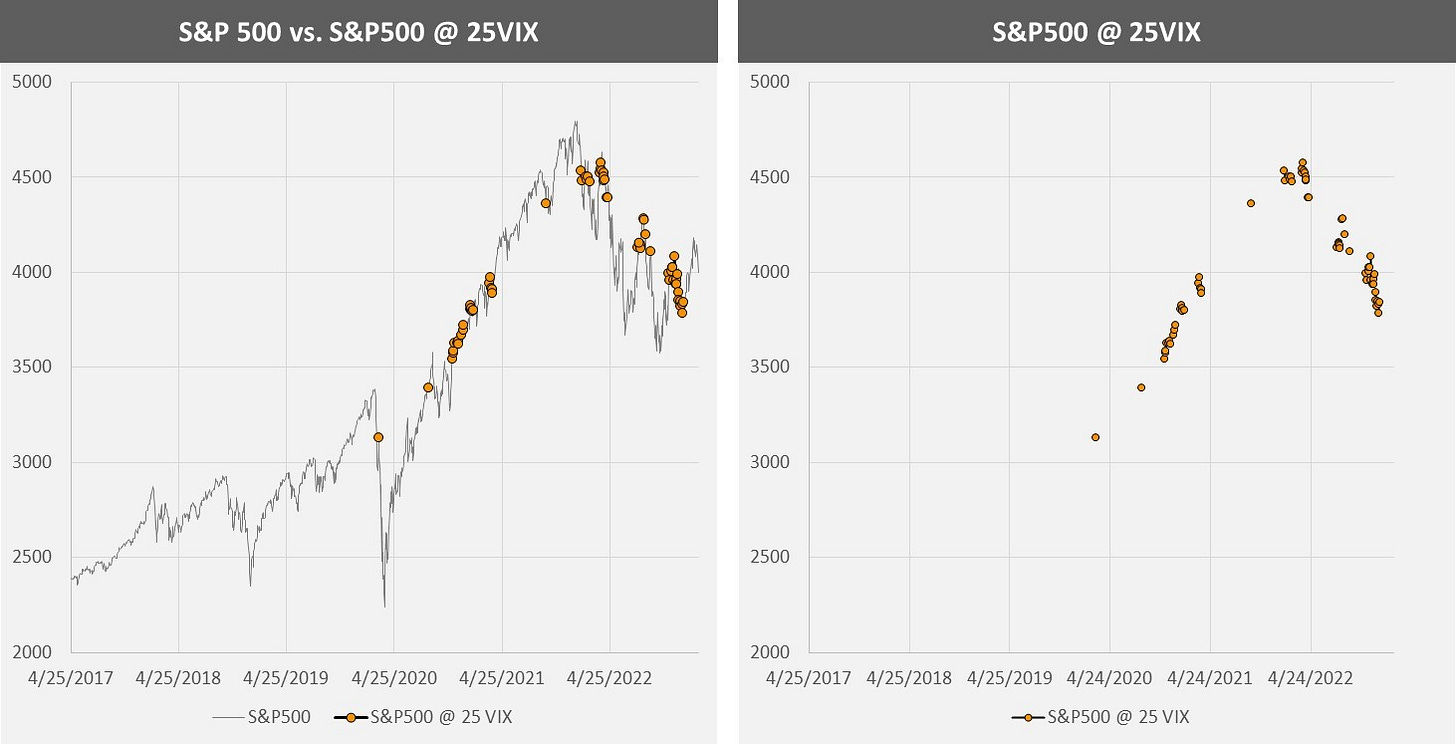
To normalize for volatility4, let’s look at S&P 500 prices on days in which VIX futures contracts closed at 255.

While the S&P 500 has experienced dramatic price swings since 2017, we can see that the trend is much more consistent after adjusting for a constant level of risk6. During the 2022 bear market, we see that on a risk-normal basis, the direction has been consistently downwards, even as nominal market prices has swung back and forth.
Using a specific example, the S&P closing price on February 22, 2023 of 3,991 is nearly unchanged from nine months earlier on May 23, 2022. But VIX futures on February 22 closed at 23, whereas the VIX traded at 30 back in May. The market price of risk declined substantially between these two points, but the S&P 500 price has stayed the same, implying that the fundamental return outlook has deteriorated. We can also make the counterargument for recent price crashes, which were driven by rising volatility.
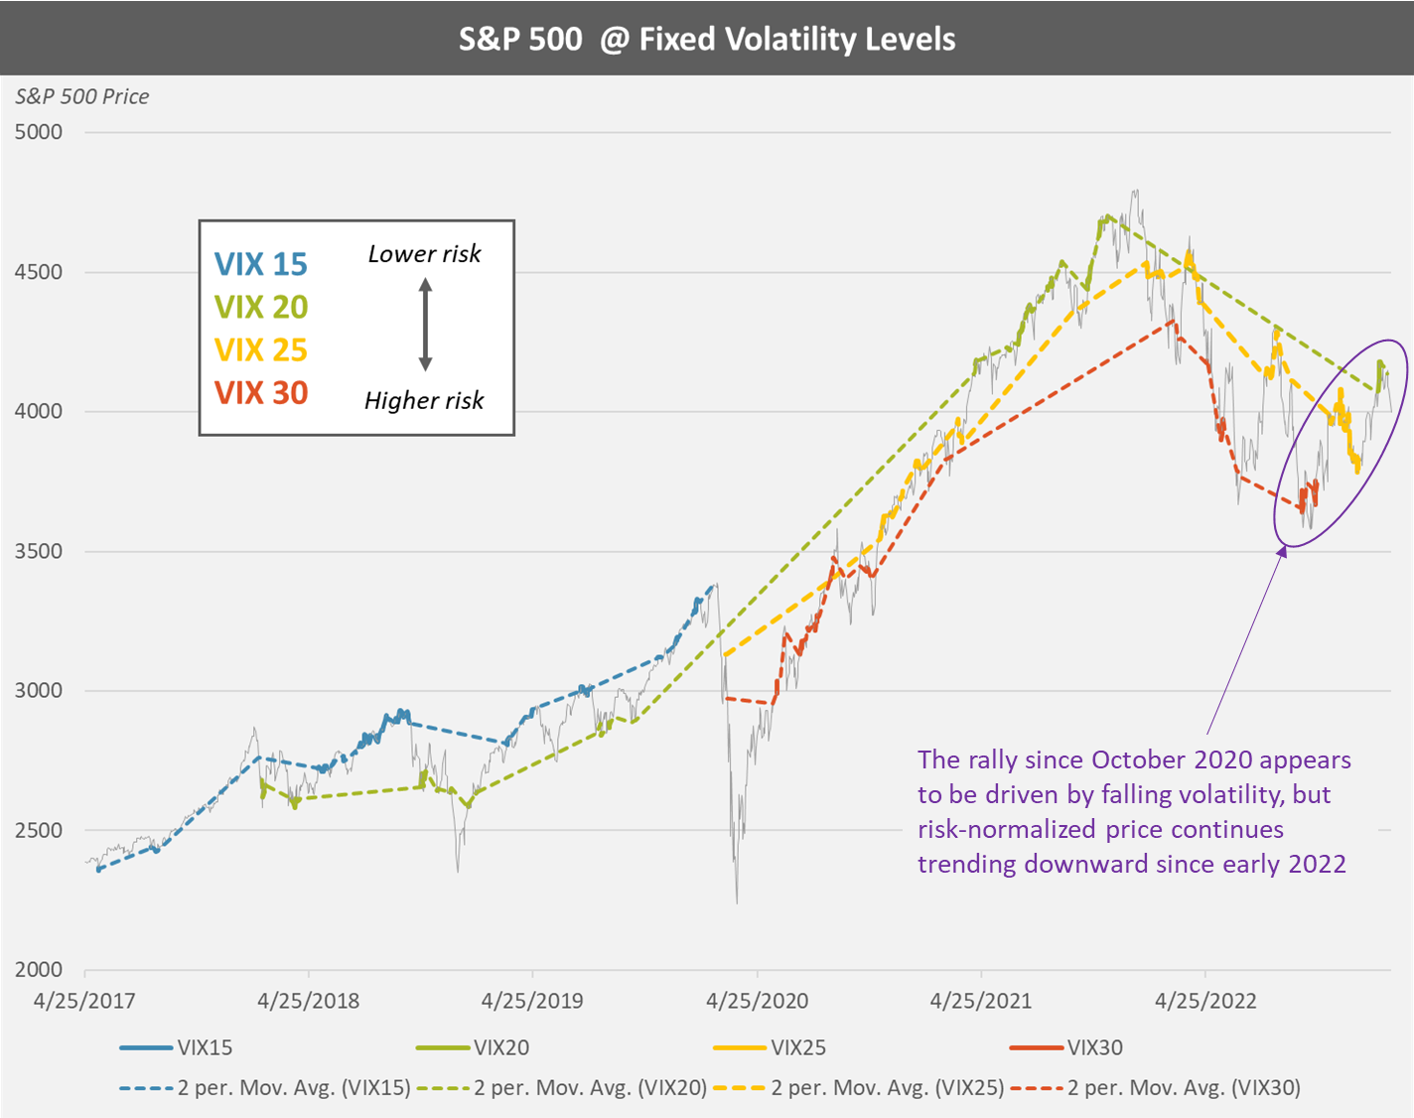
By repeating this exercise with multiple VIX levels and adding crude trendlines, we can create a band of risk-normalized price movements.
After normalizing for a fixed level of volatility, we can see the broader market trend (i.e. the changes to expected returns ignoring the risk-adjustment), which were uninterrupted by major volatility related events like Volmageddon or the COVID Crash.
Superimposing all S&P 500 data back onto the chart, we see that the rally since last October appears to be driven by falling volatility, as VIX futures fell from 30 to 20. This price action occurred within the risk-adjustment bands, but the bands continue to trend downwards.
That doesn’t mean that we should simply ignore the level of risk priced into markets7 - instead these charts demonstrates how critical volatility is to short-term price levels.
If this exercise was completed across all VIX levels, we could create a more dynamic model that could estimate how different levels of volatility would impact market prices at any given point in time - how much we expect the market to move if the VIX was to spike to 50 or fall to 15.
This is a short-term opportunity, to extent that you can identify mispriced risk (i.e. if you can correctly predict changes in volatility).
Conclusions
Implicit in equity prices are both the expectation of returns and haircuts for risk. The equity market is already risk-adjusted.
Just like a credit investor segregates an all-in yield by the risk-free rate and a credit spread, an equity investor should segregate return expectations from the risk-adjustment. Rather than a fixed spread to the risk-free rate as taught in theoretical finance, the risk-adjustment in equity markets today is volatility.
To understand market movements, it isn’t enough to quote nominal prices. You must also quote the price of volatility.
Failure to disaggregate between the two can lead to incorrect assumptions about the direction of the market. Has the market rallied because of an improved long-term outlook for earnings, or has volatility merely compressed?
Similarly, we can be aware of, and prepared for, the possibility of significant declines in nominal market prices if the risk-adjustment dramatically increases, as it tends to do every once in a while. The good news is that if the crash is solely volatility driven, it will be short-lived.
While our tendency is to ascribe market movements to fundamental factors, short-term fluctuations are often driven by changes in the risk-adjustment. If you have a short investment horizon, understanding risk and volatility is more important than fundamentals. Long-term investors should look to volatility normalized-prices to glean underlying changes in return expectations.
On Thursday February 23, 2023 the S&P 500 closed at a risk-adjusted price of 4,202. The VIX closed at 21.14.
If you enjoy The Last Bear Standing, please subscribe, hit “like”, and tell a friend! Let me know your thoughts in the comments - I respond to all of them.
As always, thank you for reading.
-TLBS
Short-term sovereign debt, such as a U.S. Treasury Bill, is very close to “Risk-Free”, as it has almost no default risk and very little sensitivity to changes in interest rates. Long-term sovereign bonds on the other hand should not be considered “risk-free”. While default risk may be minimal, the extended duration of the bonds bring significant interest rate risk, which can lead to worse returns than meme-stocks and alt-coins, as detailed in Bonds of Mass Destruction.
Or speculate with unlimited leverage, as detailed in The Return of the Calls.
On a single-stock level this will not always be true. Particularly in the world of call-driven gamma squeezes, you may see the typical inverse relationship between price and volatility flip on its head, as implied volatility increases along with price. However, on the aggregate market level, this is a rare and short-lived phenomenon when it does happen.
For options nerds, this is an upside down version of “fixed-strike vol”. Rather than look at changes in volatility at a fixed S&P level, we instead are looking at changes in S&P 500 levels based on a fixed level of volatility - it’s “fixed-vol strike”.
These charts use the the closing price of rolling second-month VIX futures contracts rounded to the nearest whole number. The reasoning is that second month futures have less noise than spot VIX, and won’t be impacted by specific events like a FOMC meeting or experience the same the downward pressure as front-month contracts as they near expiry and compress towards the spot price. This exercise could be repeated with spot VIX or another point in the futures term structure.
It’s also evident that the post-pandemic market has exhibited significantly higher volatility.
Though perhaps a long-term investor really should ignore price moves driven by volatility.


Such a nice post! Thanks Bear!
Any source where to find a fixed-vol strike chart of the market?
Seems that the cold came back here, nevertheless the coffe in Friday’s afternoon after work with TLBS is a must, not in the outside this time… thanks for another tremendous article!