Forward Guidance
#44: The Dot Plot, Yield Curve Control, and the Fed's Dilemma.
The Dot Plot
You may have heard that the Federal Reserve is hiking rates. But that’s not the whole truth.
In 2012, the Federal Reserve expanded its range of forward guidance by publishing the Dot Plot, a graphical representation of where Federal Open Market Committee (FOMC) members expect the Federal Funds rate to go in the future1. The Fed releases a new set of dots along with its Summary of Economic Projections (SEP) four times a year.
Here is the first ever Dot Plot, issued in the January 2012 FOMC meeting.
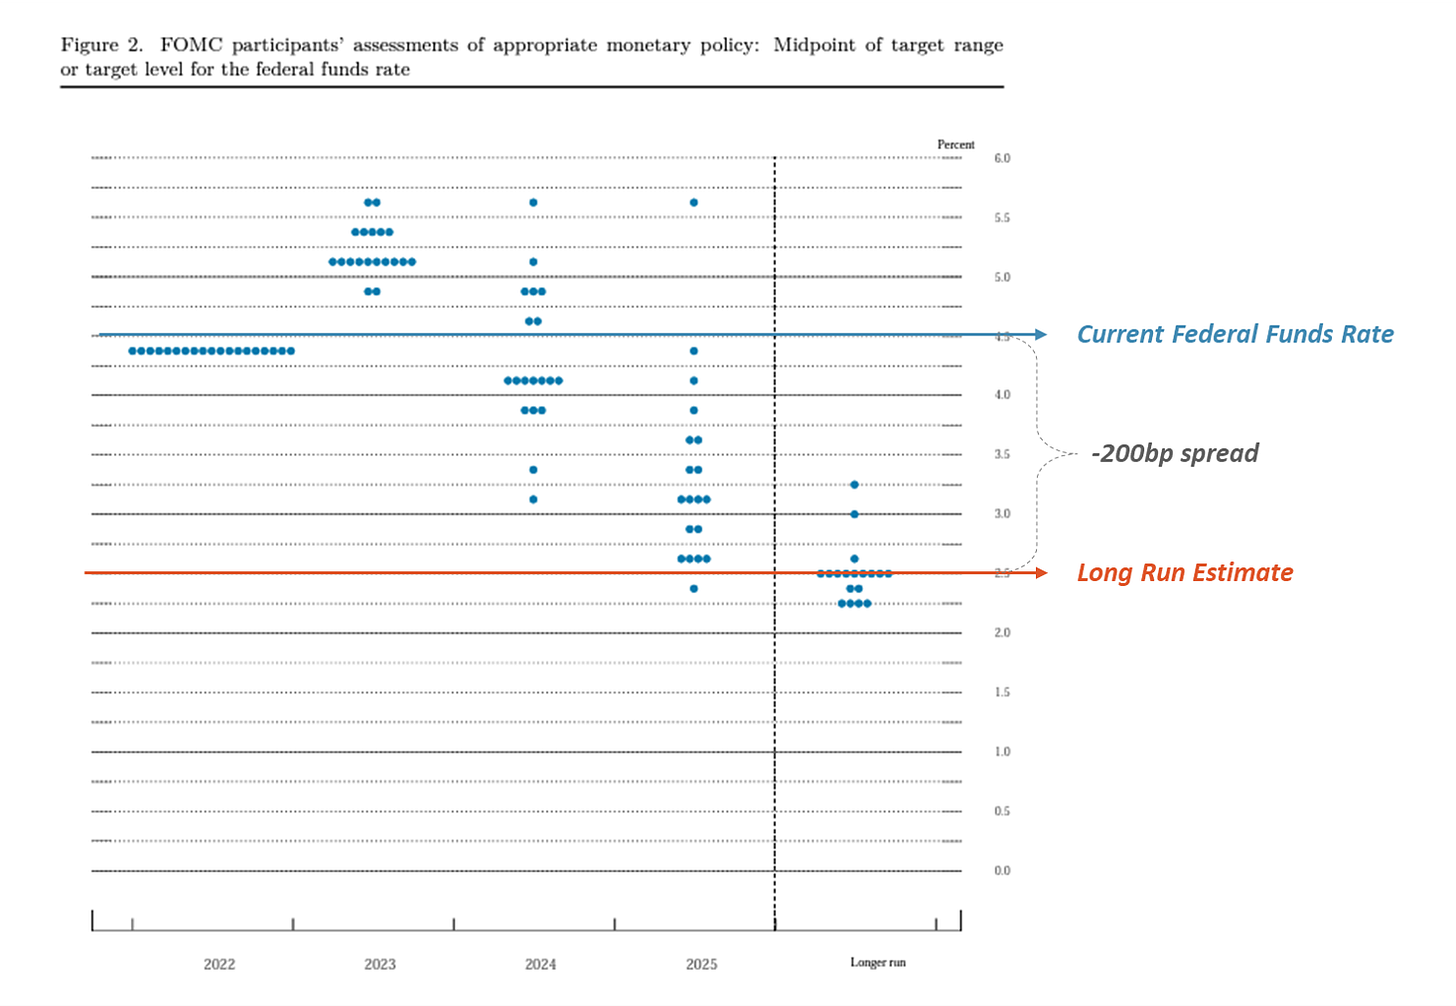
As shown above, the Dot Plot provides an estimate of the Federal Funds rate for the next two calendar years plus a longer run estimate2. This “Long Run Estimate” is meant to indicate the neutral or equilibrium rate - the final destination for interest rates to settle after temporary ups and downs.
Charting the Long Run Estimate since its inception shows the curious evolution of the FOMC’s thinking on the subject.
Despite wide fluctuations in the Federal Funds rate, the Long Run Estimate has only glided lower. Back in 2012, with low inflation and high unemployment, the median FOMC member believed the proper Long Run Estimate was 4.25%. Today, with decades-high inflation and low unemployment, the FOMC believes the Long Run Estimate is just 2.5% - unchanged since 2019.
These projections are curious - one may view them incredulously.
But rather than a true estimate of a neutral policy rate, the Long Run Estimate serves as an anchor for long-term interest rates. In other words, the Dot Plot is the Fed’s preferred method of yield curve control (YCC) - we can call it Yield Curve Guidance.
In September 2022, the FOMC set the Federal Funds rate higher than the Long Run Estimate, resulting in the first inverted Dot Plot of the forward guidance era. Today, the gap between the policy rate and the Long Run Estimate has widened to -200bps.
How much does inverted guidance actually influence the yield curve?
Below is the spread between the Federal Funds rate and the Long Run Estimate, compared to the two most commonly cited U.S. Treasury yield curve spreads (10-yr minus 2-yr and 10-yr minus 3-month).
Guidance works. The Long Run Estimate clearly influences long-term rates and helps explain the extreme inversion present in the Treasury curve today3.
In prior posts, we have wondered aloud about why long-term interest rates seem to be ignoring the possibility of sticky inflation and higher-for-longer policy rates. The simplest explanation is that long-term rates are just abiding by the Fed’s guidance4.
But why is the Fed so reluctant to raise its Long Run Estimate, even while aggressively hiking short-term rates?
Yield Curve Control
After a decade of zero-interest-rate-policy (ZIRP), a global coordinated rate hike is treacherous. Policy makers do not want to raise rates, and yet they have no choice. Failure to hike would amount to a gross abandonment of their price stability mandate.
But there is an entire universe of long-duration assets that were birthed under the assumption of permanently low rates. If long-term rates rise quickly, the value of these assets disintegrates5. Chief among them are sovereign bonds - the bedrock of financial markets - and real estate - the bedrock of the real economy.
You see the dilemma.
Central banks would prefer to tackle inflation through increases in short-term rates while engaging in some form of yield curve control to keep the long-end in check. Quantitative easing (QE), yield targets, emergency interventions, and forward guidance are all forms of YCC.
In the Pacific, the Bank of Japan (BOJ) has maintained explicit yield caps as a part of its monetary policy since 2016. If the price of Japanese Government Bonds (JGBs) falls below a certain level, the central bank will directly intervene in the market to maintain yields at their target (currently 0.50% for the 10-year JBG). In other words, the BOJ provides an explicit “put” right to investors.
Beginning in September 2022, the market began to exercise this put option, forcing the BOJ to expand its balance sheet yet again by buying JGBs with newly printed Yen. Today, the BOJ has already undone its fledgling attempts to shrink its balance sheet in order to maintain its YCC policy.
In the Atlantic, the Bank of England (BOE) has opted for emergency intervention. While there is no explicit yield target, the BOE has already proven that it will step in when someone screams loud enough.
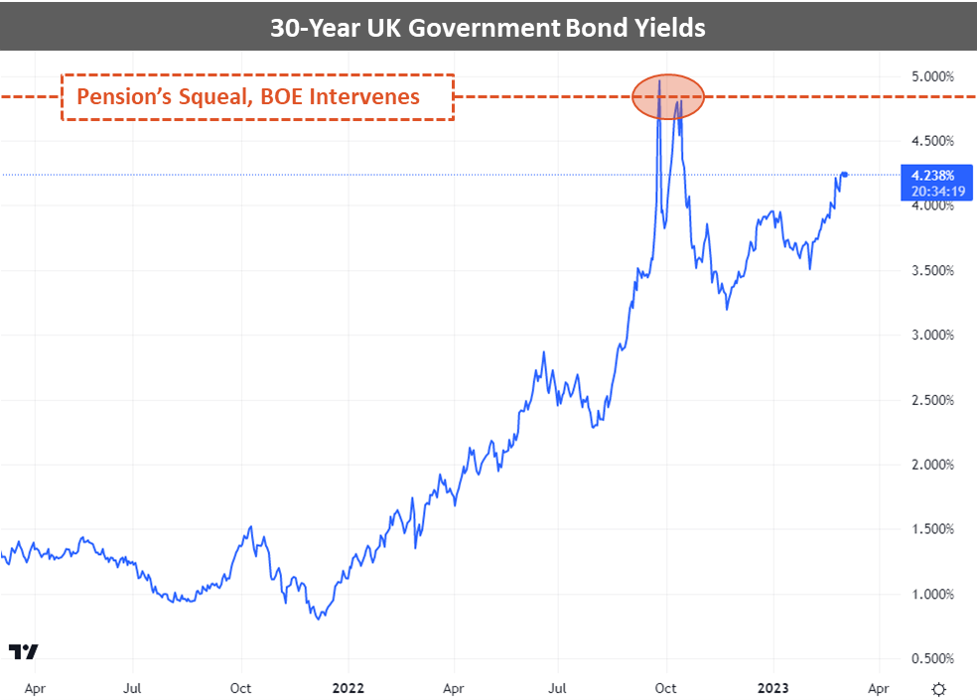
Back in September 2022, as rate hikes began to wreak havoc on ultra-long-duration UK sovereign bonds (known as gilts) the BOE stepped in with an emergency bond-buying program.
In its own words, the BOE successfully restored normal market functioning6. In practice, the market tested and successfully exercised the central bank put. Gilt yields have yet to return to the levels that prompted the intervention even as the BOE's policy rate has risen. And why would they? The strike price of the BOE put has already been established.
In the United States, the Federal Reserve has so far avoided direct intervention in the Treasury market. But perhaps this success is due to the effectiveness of forward guidance, the Dot Plot.
In the same month as the BOJ and BOE interventions, the Fed revealed its first inverted yield curve guidance, telling the market that current rate hikes are not permanent. Like a snake swallowing a gerbil whole, if the market unlocks its jaw and swallows the 2022/23 hikes, it can look forward to smooth sailing back down to the status-quo of the past decade.
The market has learned not to fight the Fed. Long-term yields remain well below the Federal Funds rate because that is where the Fed wants them.
These various methods of yield curve control have proven successful at calming sovereign bond markets and loosening financial conditions, as central bank puts are exercised and central bankers grow weak in the knees. But looser financial conditions have led to a resurgence in asset prices, capital markets activity, bank lending, and housing sales. Inflation has reaccelerated.
You see the dilemma.
The Fed’s Dilemma
At the next FOMC meeting on March 22, 2023, the Fed will reveal its revised policy rate and latest Dot Plot. The Federal Funds rate will rise - perhaps by 25 or 50bps. The Long Run Estimate will almost certainly remain unchanged at 2.5%. Yield curve guidance will invert further.
It’s reasonable to ask why.
The practical answer is that the Fed wants an inverted yield curve. It hopes that it can maintain credibility and tame inflation via the short-end of the curve while preserving financial stability and asset valuations in the long-end. Indeed, this would be an ideal outcome if the Fed can pull it off7. Early signs don’t bode well.
The 2.5% Long Run Estimate is the last anchor to the ZIRP regime, and so far, the Fed has refused to let go. So long as it maintains this guidance, the Fed is declaring that both inflation and rate hikes are transitory. The market is merely following orders.
Contrarily, if the Fed was willing to raise its Long Run Estimate - even just 25bps - it would signal the possibility of a new higher-for-longer rate regime for the first time. The yield curve would respond, asset prices would be forced to correct, and financial conditions would tighten. Perhaps it’s just the shock that’s needed (but don’t hold your breath).
If you enjoy The Last Bear Standing, please subscribe, hit “like”, and tell a friend! Let me know your thoughts in the comments - I respond to all of them.
As always, thank you for reading.
-TLBS
Ben Bernanke’s explanation for introducing explicit forward guidance can be found here.
The Federal Reserve provides a loose definition for what exactly qualifies as the “longer run”. To wit: “The longer-run projections […] are the rates […] at which a policymaker expects the economy to converge over time—maybe in five or six years—in the absence of further shocks and under appropriate monetary policy […] Policymakers' longer-run projections […] may be interpreted, respectively, as estimates of the economy’s normal or trend rate of growth and its normal unemployment rate over the longer run.”
Its also possible that this influence could impact the reliability of an inverted yield curve as a harbinger of recession.
There will always be some mismatch between the Dot Plot and the market. The Federal Funds futures market may show a slower or faster path than the Dot Plot, but the general shape and direction of the two seem to hold. Today, both believe the Fed will cut rates substantially over the medium term.
Detailed here in Bonds of Mass Destruction.
The UK intervention will likely be regarded as a success for several reasons. In September, both UK government bonds and its currency (GBP) were in freefall. The theoretical risk of gilt market intervention was to exacerbate the fall of the GBP, since buying gilts would put more GBP into circulation and could add to downward pressure on foreign exchange rates.
In reality, the intervention saved both the gilt market and the GBP, which rebounded fiercely on the news. The weakness of the currency was driven by instability in the gilt market and the small incremental issuance of new GBP paled in comparison to the benefit of restoring financial stability.
Finally, unlike the BOJ, the BOE was able to unwind its emergency bond purchases within several months, selling those bonds back into a more liquid market at a higher price. This was a win-win for the BOE and perhaps will embolden other central bankers to react in a similar manner.
But was there ever a question that central banks have the tools to ensure financial stability by firing up the printing presses? The greater question is whether they can fight inflation while simultaneously bailing out financial markets. The jury is out.
Taming inflation may very well require higher long-term rates. Perhaps guidance of 4.0% for both short-term and long-term rates would prove more effective than a short-term rate of 5.0% and long-term guidance of 2.5%. We are unlikely to find out.


I always look forward to your insightful articles.
Can you make an update about Evergrande and Chinese banks? Haven't heard about that for a while